Sentiment report shows the amount of open long and short trades for IG retail traders. This is important as institutional traders often are on the other side of retail trades. Therefore, the IG Client Sentiment report is a contrarian trade signal.
In this IG Client Sentiment report chart we can see candlesticks of GBPUSD with sentiment breakdown of buyer and sellers over layed on the chart. In the top chart price is smoothly trending upwards while the # of short trades by retail traders is growing.
In the lower part of the report, it shows a line chart graphing the amount of traders holding long and short positions. Red line is # of account with short open trades and blue line # of accounts with long open trades. This data is exclusive to IG clients only.
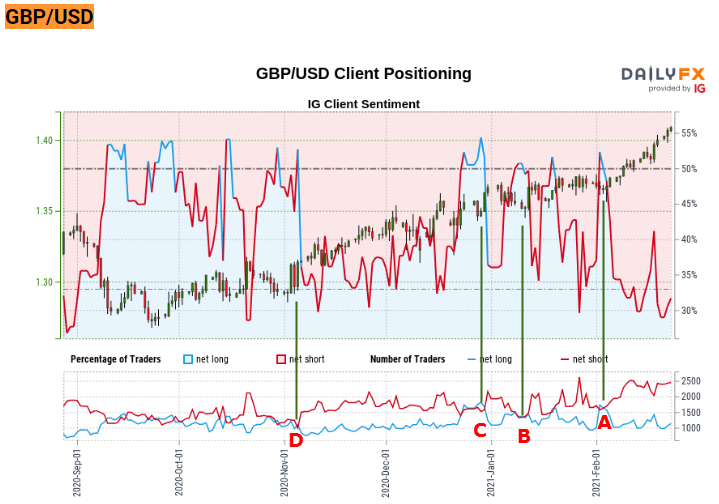
Point A, B, C and D shows when short and long positions were virtually equal. There is a green line going from these points to the price chart to see how price behaves when the blue and red line are equal and then begin to separate. The IG Client sentiment report is a contrarian signal, so when long positions begin to grow the report suggest taking short trades. Similarily, when short positions begin to grow the report suggest taking long trades. As always, no indicator is perfect and no indicator should be used in isolation. It is ideal to pair the information from the report with other technical indicators. For example, I find it best to pair it with price action analysis.
