Weekly Chart Highlights
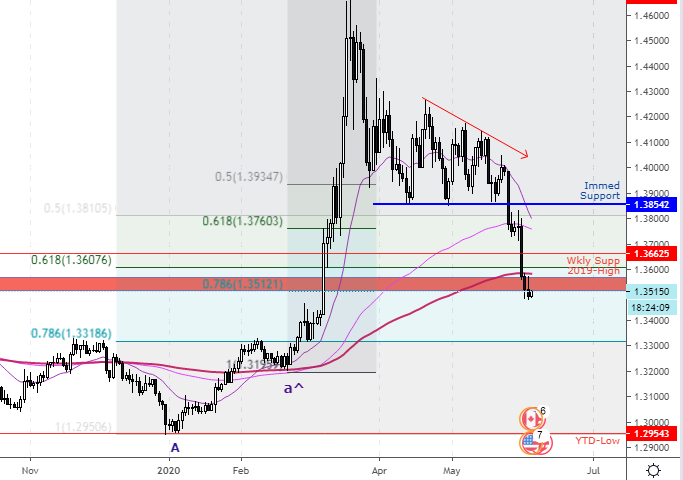
The most recently closed weekly bar was down and closed below immediate support. As of Wednesday June 3, price has continued to move further down for USDCAD. I will have to wait for the close on Friday to determine if support may hold – will help determine next weeks direction.
- Price broke through 2019 high and past 0.618 Fibonacci, but only the close of the bar will suggest if level breached.
- Weekly 21, 50 and 100 EMA aligned bullish, but price is below 21 EMA
- Price broke well past weekly 21 EMA and hovering around weekly 50 EMA
- Some confluence of support at 0.7861 and 100 EMA levels

News Items
- Bank of Canada Interest Rate Statement – Wed June 3rd
- USD NFP – Fri Jun 5th
- USD FOMC – Wed June 10th
Daily Chart Highlights
- From weekly chart, identified resistance structure, daily bar has 2 closes in the red rectangle
- EMA Alignment: 21 above 100 and 100 above 200; aligned bullish, but price is below 200 EMA
- 21 EMA broken below immediate support but has not crossed 100 EMA
- BoC rate announcement Wednesday, so far, no impact
- Be aware, NFP is Friday
Hourly Chart Highlights
- EMA Alignment: 21 below 100, 100 below 200
- All week, prices has moved down, almost no retrace
- Fib 50% retrace just below previous support low
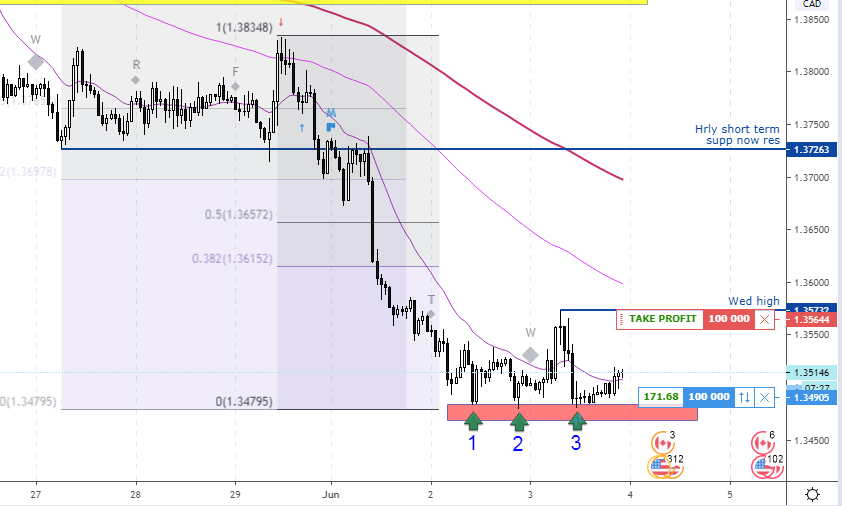
Wed Jun 3rd
- Open trade executed 11AM, Wed Jun 3
- On 3rd attempt into red rectangle area, open buy trade
- Profit target, Wed high. About 3 to 1
- Stop loss area below red rectangle, EMA’s currently aligned bearish – 10PM stop loss moved break even
