Weekly Chart
For the week, USDCAD has moved sharp to downside, breaking below short term immediate support of 1.38486. Today price action also broke below weekly 21 EMA.
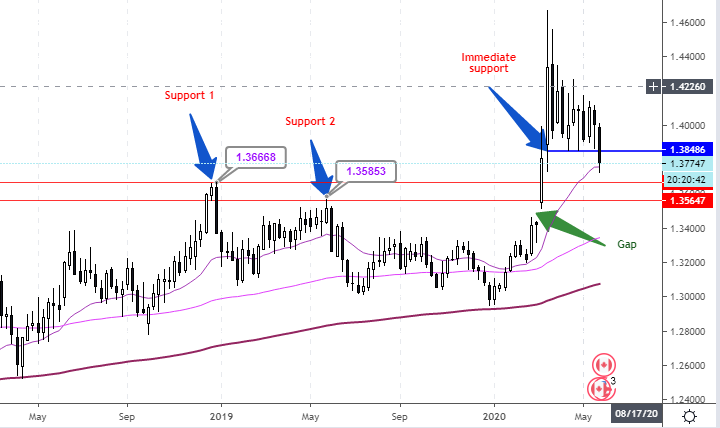
Where will weekly bar close?
I expect weekly 21 EMA to be tested again tomorrow, Friday. I will look for support 1 to be tested if price continues to move down.
Thoughts:
- Though weekly chart is biased to downside, do NOT impulsively short trades, especially around weekly 21 EMA and or around support 1 level (1.38660).
- Be patient, wait for retest of immediate support around 1.38450 – next week?
- Buy trades: below weekly 21 EMA, around support 1 and or 2. Check day chart for more specifics.
Daily Chart
I will be patient. I will not force a trade and must have a plan.
- Last 3 closed daily bars: break immediate support
- Big down move, breaking support
- Then, next two days price remains below broken support
- Last closed bar with long wick on top, wick on bottom and almost no body.
3 EMA Alignment and price: all 3 EMA’s aligned up, 21 above 100, 100 above 200.

- Price below daily 21 EMA and immediate support, but 21 still above immediate support.
- Price at 100 EMA. Price above 200.
- All 3 EMA were last together around Feb 17-21, since then strong Bullish alignment.
- Look for retest of broken support, may become resistance.
- Price bias is downward, so will move more impulsively down and or spend more time moving down.
- Fibonacci Retracement of up trend on daily chart: price has found some support at .618 fib retracement.
Hourly Chart
- Current down leg broke through immediate support and last months low.
- Chart includes Fib retracement of hourly chart down move
- Confluence at .382 tracement level, which aligns around last months low and broken immediate support – potential resistance, now.

- All 3 EMa aligned bearish: 21 below 100, 100 below 200.
- 21 and 100 have broken confluence support area – that’s medium strength bearish.
- Wait for retracement, check alignment and look for short trade around 1.3850.
- Possible short trade around confluence area, 1.3850. Wednesday high looks like a short term resistance?
- Stop loss if support turn resistance does not hold and 21 crosses 100 EMA – yellow rectangle area.
- Take profit back down at Wednesday low and or support 1 from weekly chart
- No trade likely available tomorrow, Friday
