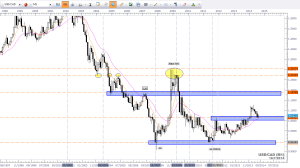
The chart has many vertical lines identifying dates for key levels.
The Horizontal lines identify key price levels. If price is above the line then its serves as potential support. Likewise, if price is below the line then it may be resistance.
The orange line is 8 period EMA and the purple line is the 21 period EMA
