CADJPY Post Market Homework & Pre Market Preparation – 14th-19th
Possible Buy trade Levels: 102.00 / 101.89 – 101.34
Possible Sell trade Levels: 103.18 / 103.60
These observations are to understand the big picture in CADJPY.
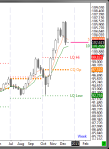
Daily Bar Chart: before the open Sunday Dec 14th
- Of the current 1362 pip strong bull run up CADJPY last week saw a 444 pip retrace down from the high put in earlier in the week.
- Of the current up impulse leg the 38% retrace is at 101.348 which also is a potential price action support level.
On the daily bar chart, price has rotated below the 5,10, and 21 ema lines, closing below them on Wed, Thurs, and Friday. Price may make it up to the 10 EMA and if it does that could be a high probability short trade.

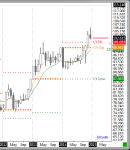
Weekly Bar before the open Sunday Dec 14th
- The one-time framing of weekly bars stopped last week. Last weeks weekly bar engulfed the previous 3 weeks highs and lows.
- The weekly bar closed below the 5 ema line but above the 10 (101.89), which it has not touched since the end of October. A buy trade on or near the 10 ema may be profitable.
- The 2013 high at 101.110 was broken back in the first week of November, but it not been retested since being broken. Buyer might be waiting for this level and it may provide price action support.
- Price is well above last quarters high and the current quarters open.
Monthly Bar before the Open Sunday Dec 14th
- Even though the daily bar and the weekly bar saw bearish selling last week, the monthly bar still is well above last months open though it is a down bar at present.
- Potential target down is last years high at 101.053 which is also close to the 5 month ema line.
- Price is well above the current years open.


